

Ever wondered how businesses predict sales, scientists track climate change, or cities plan public transport? Often, the secret lies in a deceptively simple mathematical tool: the linear model. While the phrase might sound abstract, linear models are the ultimate problem-solving workhorse, turning scattered data into clear, actionable insights. This guide will demystify linear models and equations, moving you from theory to practical application. By the end, you’ll be able to identify and interpret the intercept of a linear model, calculate and interpret the slope of a linear model, and confidently state the equation of the line in slope-intercept form.
What Are Linear Models and Equations?
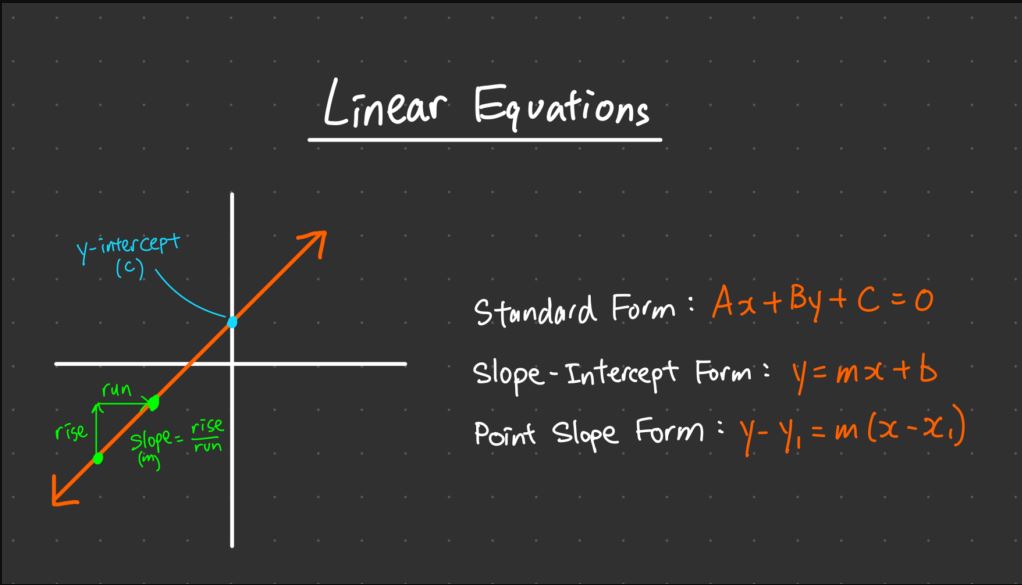
At its core, a linear model is a relationship between two variables that forms a straight line when graphed. It’s based on the principle of a constant rate of change. The mathematical expression of this model is a linear equation.
The most powerful and common form is the slope-intercept form:
y = mx + b
In this equation:
-
yis the dependent variable (the outcome you’re predicting or explaining). -
xis the independent variable (the factor you’re using to make the prediction). -
mis the slope of the line. -
bis the y-intercept.
This simple formula is the key to interpreting everything from economics graphs to scientific experiment results.
Identify and Interpret the Intercept of a Linear Model
The y-intercept (b) is the point where the line crosses the y-axis. On a graph, it’s the value of y when x = 0.
How to Find It: On a graph, look where the line touches the vertical y-axis. In a table of values, find the y value when x is zero. In the equation y = 4x + 20, the intercept b is 20.
How to Interpret It: The intercept represents the starting value or baseline value of your dependent variable (y) before your independent variable (x) begins to exert its influence.
-
Real-World Example: A cell phone plan has a monthly cost modeled by
C = 0.05m + 25, whereCis cost andmis minutes used. The intercept is 25. This means the base cost of the plan is $25 per month, even if you use zero minutes.
Calculate and Interpret the Slope of a Linear Model
The slope (m) is the engine of the linear model. It measures the steepness and direction of the line, representing the rate of change.
How to Calculate It: Slope is “rise over run”: the change in the y-values divided by the change in the x-values between any two points on the line.
m = (change in y) / (change in x) = (y2 - y1) / (x2 - x1)
From the equation y = 4x + 20, the slope m is 4.
How to Interpret It: The slope tells you how much the dependent variable (y) changes for every one-unit increase in the independent variable (x).
-
Positive Slope (
m > 0): Asxincreases,yincreases. (e.g., More study hours correlate with higher exam scores). -
Negative Slope (
m < 0): Asxincreases,ydecreases. (e.g., The more items purchased in bulk, the lower the price per item). -
Real-World Example: In the cell phone plan
C = 0.05m + 25, the slope is 0.05. This means each additional minute used adds $0.05 to the total monthly bill.
State the Equation of the Line in Slope-Intercept Form
Constructing the equation y = mx + b is the final step in building your linear model, synthesizing your understanding of slope and intercept.
Steps to Find the Equation:
-
Calculate the Slope (
m): Use two known points(x1, y1)and(x2, y2)from the data or graph. -
Find the Y-Intercept (
b): Substitute the slope (m) and the coordinates of one known point(x, y)intoy = mx + b, then solve forb. -
Write the Equation: Plug your calculated
mandbintoy = mx + b.
Worked Example:
A taxi service charges a flat pick-up fee plus a rate per mile. After a 2-mile ride, the cost is $9. After a 5-mile ride, the cost is $18.
-
Points: (2, 9) and (5, 18).
-
Calculate Slope:
m = (18 - 9) / (5 - 2) = 9 / 3 = 3. The cost increases by $3 per mile. -
Find Intercept: Use point (2, 9):
9 = 3(2) + b→9 = 6 + b→b = 3. The flat pick-up fee is $3. -
State the Equation: The linear model is:
Cost = 3*(miles driven) + 3, ory = 3x + 3.
Interpreting Linear Models in Context
The true power of linear models lies in interpretation. Always translate the mathematical components (m and b) back into the context of the problem.
-
Intercept (
b): “Whenxis zero,ystarts at this value.” -
Slope (
m): “For every one-unit increase inx,yincreases/decreases bymunits.”
Critical Thinking Note: Real-world data is rarely perfectly linear. Models are simplifications. Always consider whether a linear relationship is reasonable and be cautious about making predictions far outside your given data range.
Mastering linear models is less about abstract algebra and more about gaining a superpower to decode the world. By learning to calculate the slope, interpret the intercept, and state the final equation, you move from manipulating numbers to telling the story hidden within data. This skill set is foundational, not just for math class, but for making informed decisions in science, business, and everyday life. Next time you see a trend line on a graph, you’ll see not just a line, but a clear, predictive narrative waiting to be understood.